Most gardening advice starts with your hardiness zone. For chiles, the more useful questions are when your frosts end and begin, and how warm the weeks in between are. The temperatures chiles need are covered in the Climate chapter, and sowing and planting-out dates in Seed starting and transplanting.
Why season length matters more than winter hardiness
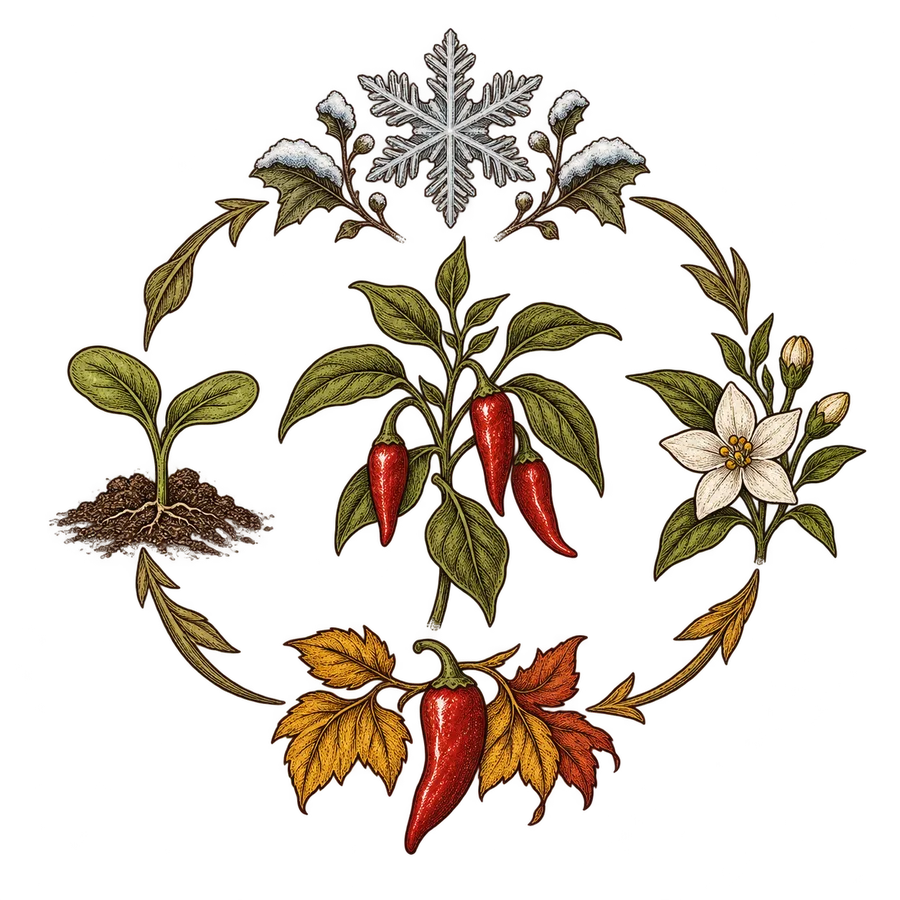
Chiles are perennial sub-shrubs from South America, grown as annuals wherever freezing occurs. The Chile Pepper Institute notes that only a few places in the continental United States can keep them as perennials: southern California, Florida, a small part of South Texas and a small area of southern Arizona.1 Everywhere else, a chile lives from the last spring frost to the first autumn frost, so how cold your winter gets does not affect it.
What does matter is whether that season is long and warm enough to ripen fruit. Oregon State University Extension says peppers mature slowly: under good conditions they take at least 45 to 55 days to produce harvestable fruit after the flowers are pollinated, and where days and nights are cool it can take an extra 15 to 20 days. For that reason, it advises that some cultivars should not be grown where the frost-free season is shorter than 120 days.2
Hardiness zones measure something else. The USDA map is based on the average coldest winter temperature, and the USDA describes it as a general guide for growing perennial plants. The same page notes that warm-season heat and moisture balance are particularly important to how plants perform.3 Two gardens in the same zone can have very different summers, and for chiles the summer is what counts.
Frost dates and the frost-free season
- Freeze
- Air temperature below 0 °C (32 °F)4
- Hard freeze
- Air temperature below −2 °C (28 °F)4
- Frost
- Can form without a freeze; NOAA’s tables use 2 °C (36 °F) as the frost threshold4
- Average last frost date
- The date after which a later freeze has less than a 50% chance5
- Frost-free season
- Some pepper cultivars should not be grown where it is under 120 days2
A frost date is not a fixed day. It is a probability worked out from 30 years of past temperatures.4 NOAA explains that the average last spring freeze date is the date after which the chance of freezing temperatures drops below 50%: past it, temperatures have historically been more likely to stay above freezing than not.5 In plain terms, a later freeze still comes in about one year in two.
NOAA’s freeze tables also give dates at other probability levels. NC State Extension explains that at the 90% level there is a 90% chance of a frost on or after that date, the early, risky date, while at the 10% level there is only a 1-in-10 chance, the late, safe date. It suggests the 10% spring date for cautious planting and the 50% date for moderate risk.4 The gap can be wide: for Boulder, Colorado, NOAA gives May 6 for the 50% date but May 18 for 10%.5
Autumn works the same way in reverse, and the span between the last spring freeze and the first autumn freeze, the freeze-free period, is given as a probability too. Frost can form even when the air stays above 0 °C (32 °F).4 Together these are why the Seed Starting chapter waits a while after the average last frost date before planting out.
In the Southern Hemisphere, the last frost falls in your spring, around the months northern calendars call autumn, and your chile season runs across the new year. The logic is identical: count forward from your last spring frost and back from your first autumn frost, whatever months they fall in.
Köppen climate types, in plain words
The Köppen-Geiger system is one of the most widely used climate classifications, designed by the botanist Köppen to follow the world’s main vegetation types. It sorts land climates into five main classes and 30 sub-classes, using thresholds for monthly temperature and rainfall and how they vary through the year.6 Each climate gets a code of two or three letters. The first letter is the main class:
| Letter | Class | What defines it |
|---|---|---|
| A | Tropical | Coldest month averages 18 °C (64 °F) or more6 |
| B | Arid | Too little rain for the temperature; h (hot) if the year averages 18 °C (64 °F) or more, k (cold) if less6 |
| C | Temperate | Warmest month above 10 °C (50 °F); coldest month between 0 °C (32 °F) and 18 °C (64 °F)6 |
| D | Cold | Warmest month above 10 °C (50 °F); coldest month at or below 0 °C (32 °F)6 |
| E | Polar | Warmest month at or below 10 °C (50 °F)6 |
The other letters describe rainfall and summer heat. In C and D climates, s means a dry summer, w a dry winter and f no dry season. The third letter describes summer: a means the warmest month averages 22 °C (72 °F) or more, b means it is cooler than that but at least four months average above 10 °C (50 °F), and c means fewer than four months do.6 So Cfa is temperate with no dry season and hot summers, Csb is temperate with dry summers that are warm rather than hot, and BWh is a hot desert.
For chile growers the letters give a first impression. In a tropical (A) climate heat and rain are likely to matter more than frost; an arid (B) one means planning for irrigation. In C and D climates, watch the summer letter: b and especially c summers are cooler, so fewer weeks will reach the temperatures set out in the Climate chapter. The classes are built from monthly averages,6 though, and chiles respond to nights and hot spells, so treat the type as a starting point.
USDA and RHS hardiness zones, for readers who know them
The USDA map is based on the average annual extreme minimum winter temperature, in zones 10 °F (about 5.6 °C) wide from zone 1 (coldest) to 13 (warmest), each split into a and b halves 5 °F (about 2.8 °C) apart. The current edition uses 1991–2020 data and shows the average lowest winter temperature, not the coldest ever.3
The RHS hardiness ratings run in nine steps from H1a to H7, set by the lowest temperature a plant is likely to withstand. The RHS lists an approximate USDA zone beside each, but its ranges are absolute minimum winter temperatures, not the long-term average extreme minimum used for USDA zones.7
| RHS rating | Temperature range | What it means |
|---|---|---|
| H1a | Warmer than 15 °C (59 °F) | Under glass all year7 |
| H1b | 10 to 15 °C (50 to 59 °F) | Outdoors in summer in sunny, sheltered spots, but best under glass7 |
| H1c | 5 to 10 °C (41 to 50 °F) | Outdoors in summer in most of the UK while days are warm7 |
| H2 | 1 to 5 °C (34 to 41 °F) | Tolerates low temperatures but will not survive being frozen7 |
| H3 to H7 | 1 °C (34 °F) and below | Half-hardy to very hardy7 |
Both systems answer “will this plant survive my winter?” For a chile grown as an annual, the answer is no wherever it freezes,1 and that does not stop it cropping well in summer. Your zone matters mainly if you plan to overwinter plants indoors; it does not tell you when to plant out or how long your season is.
Reading your own season
Work through these in order.
- Find your frost dates. In the United States, NOAA’s 1991–2020 Climate Normals give, for thousands of locations, the date past which the chance of a spring freeze drops below 50%, and later dates for lower levels down to 10%.5 Elsewhere, try your national weather service or the climate tool below. Note the probability level: the 50% date is the usual “average” date.4
- Count your frost-free days. Measure from the last spring frost to the first autumn frost. Oregon State’s rule of thumb is that under 120 days is too short for some cultivars.2
- Check your nights. Frost-free is not the same as warm enough. Nights can stay above freezing yet below the 10 °C (50 °F) that University of Minnesota Extension sets as the minimum night low for transplanting peppers.8 The Climate chapter explains the night and daytime temperatures chiles need.
- Match varieties to your season. Oregon State suggests checking the “days to harvest” on the seed packet or catalog to pick a cultivar that suits your season length.2 The Chile Pepper Institute’s growing tips also advise choosing early-maturing varieties.1
- Allow for your own garden. The USDA notes that blacktop and concrete create small heat islands, that small hills and valleys create frost pockets, and that a sheltered spot in front of a south-facing wall can be warmer than the rest of the garden.3 In the Southern Hemisphere, the warm wall faces north.
If the numbers come out short, you can still grow chiles. Oregon State recommends row covers, plastic mulch or a greenhouse to give fruit enough warmth to mature, and notes that peppers can be grown as perennials in a greenhouse kept at the right temperatures.2 Starting seed indoors gives plants a head start; the Seed Starting chapter gives the timing.
Find your chile season
Climate data: TerraClimate 1991–2020 normals (Abatzoglou et al. 2018, public domain) and Köppen-Geiger V3 (Beck et al. 2023, CC BY 4.0). Towns: GeoNames (CC BY 4.0). Estimates for a typical year. How we estimate
How the climate tool estimates your season
The tool estimates a town’s frost dates, chile season and climate type from published climate data. The results are typical values for a 30-year period, not a forecast for any one year.
Temperature data
Temperatures come from TerraClimate (Abatzoglou et al. 2018), the Climatology Lab’s global monthly climate dataset for land at about 4 km (1/24 degree) resolution. The lab publishes 1991–2020 climatologies, and the tool uses their monthly average daily highs and lows. The lab notes its limits: it cannot capture variability finer than its parent datasets, including temperature inversions, and validation is limited in data-sparse regions.9 Valleys, hilltops and coasts can differ from the grid cell around them.
From monthly averages to daily values
The tool places each month’s average at mid-month and draws a smooth curve through the twelve points, giving a typical high and low for every day of the year. All the dates below are read from this curve, including Southern Hemisphere seasons that run across the new year.
Frost dates
A typical low a few degrees above freezing still hides some nights that freeze, so the tool does not wait for the curve to reach 0 °C (32 °F). It marks the last spring and first autumn frost where the typical nightly low crosses a higher threshold, calibrated against NOAA’s 1991–2020 freeze-date normals: the value that best reproduces US stations’ 50% dates for a 0 °C (32 °F) freeze.5 Read the tool’s frost dates like NOAA’s average dates, as an even chance of frost after the spring date or before the autumn one.4 Where the curve never drops below the threshold, the tool reports no frost in a typical year; where it never rises above it, too cold for outdoor chiles.
Chile season
The chile season is the longest run of days that meets the Climate chapter’s two warmth tests. The typical nightly low must stay at or above 10 °C (50 °F), University of Minnesota Extension’s minimum for planting peppers out.8 The daily average must also reach about 17 °C (62.5 °F), which falls halfway between the Chile Pepper Institute’s transplanting conditions of 21 °C (70 °F) days and 13 °C (55 °F) nights.1 The Climate chapter explains both, and the heat-stress level used to flag months too hot for fruit set. Seed-starting and transplant dates follow the rules in the Seed Starting chapter, counted from the estimated last frost.
Climate type
The Köppen type comes from version 3 of the Köppen-Geiger maps by Beck and colleagues, at 1 km resolution, using the 1991–2020 map.10 Checked against weather stations worldwide, Beck and colleagues report classification accuracies of 79.2% to 86.4% for their maps.6
Checked against U.S. weather-station freeze records at 6,949 sites, the estimated frost dates were typically within 6.0 days (median), and within 24.0 days for nine in ten sites.11 The fit is weakest in subtropical climates, where occasional freezes do not show up in a 30-year average: Florida, Hawaii, Louisiana and Texas stations had the largest errors in this check.11
Sources
- Growing Tips Chile Pepper Institute, New Mexico State University · accessed 2026-09-27
- Grow Your Own Peppers (EC 1227) Oregon State University Extension Service · accessed 2026-09-27
- USDA Plant Hardiness Zone Map: How to Use the Maps USDA Agricultural Research Service · accessed 2026-09-27
- Interpreting Freeze / Frost Probabilities from the National Centers for Environmental Information NC State Extension · accessed 2026-09-27
- Interactive map: average date of last spring freeze across the United States NOAA Climate.gov · accessed 2026-09-27
- High-resolution (1 km) Köppen-Geiger maps for 1901–2099 based on constrained CMIP6 projections (Beck et al. 2023, Scientific Data 10:724) Scientific Data · accessed 2026-09-27
- RHS hardiness rating Royal Horticultural Society (RHS) · accessed 2026-09-27
- Growing peppers University of Minnesota Extension · accessed 2026-09-27
- TerraClimate (Abatzoglou et al. 2018, Scientific Data 5:170191) Climatology Lab · accessed 2026-09-27
- Köppen-Geiger maps (version 3) GloH2O · accessed 2026-09-27
- U.S. Climate Normals 1991–2020 (annual/seasonal, by station) NOAA National Centers for Environmental Information (NCEI) · accessed 2026-09-27